I hate math. A lot.
But, since I live in a capitalist society that requires me to make an income, I like keeping track of my money to make sure I’m spending it in the right places.
Also, the legal mafia government says I have to pay them protection money a portion of my income as taxes every so often. To make that as easy as possible, I put together this awesome spreadsheet and accounting method.
I call it the “E Z Accounting” method, and I’m going to show it to you today, in this blog post.
Please note that I am not an accountant or anything like that and if you use anything I teach you here, I am not responsible.
I am simply showing you what I do and what works for me. You can and should adjust to make it work for you and what you need.
You should always consult with a licensed accountant for anything important.
Download the free spreadsheet:
First, you need to get the spreadsheet. Put in your email below and I’ll have it emailed to you.
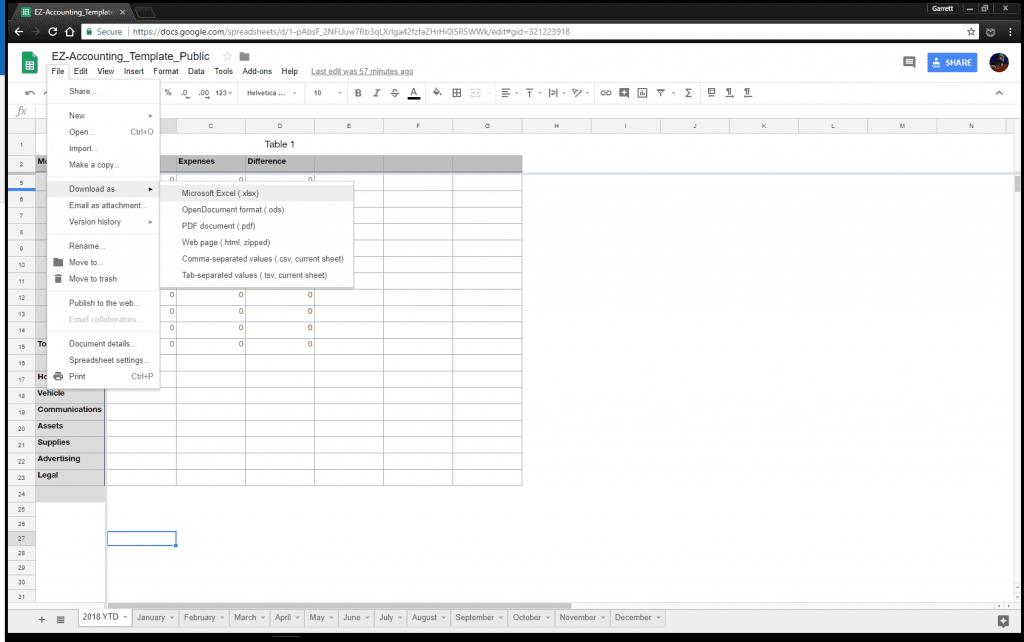
It’s a Google Spreadsheet but you can download any format you like by going to “File” and “Download as”.
Or click “Make a copy…” if you want to use it in your own Google Drive account, like I do.

Start filling out the spreadsheet:
Now that you’ve got it downloaded, you can start filling out the spreadsheet.
It’s probably not hard to figure out on your own, but I put together a quick and easy guide. It’s the rest of this post. I even made pictures!
Maybe I’ll make a video, too.
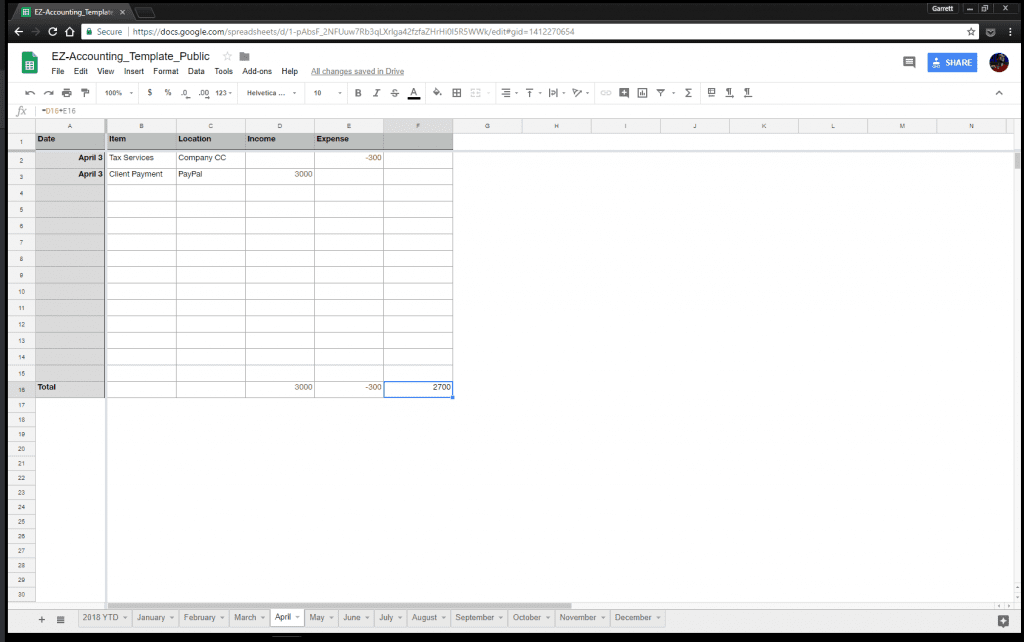
I threw some example stuff in before taking the screenshots below. We’ll take a look at it closer underneath the image.

Let’s take a look at each column.
- Date – I shouldn’t have to explain this one to you.
- Item – This is the item that either came in or went out.
- Location – This is where the money went or came from.
- Income – If the item is income, you put it here.
- Expense – If the item was an expense, you put it here (don’t forget to put a “-” in front of it).
I filled out two example items to show how the spreadsheet works. We’ve got an income and an outcome expense.
As you can see in the image, we spent $300 on tax services this month, but received $3000 from a client payment. Woohoo!
Note that these are not real. They’re just an example.
Down at the bottom is a Total line, which will have Total for Income, Total for Expenses, and then to the right of that (squared in blue in the image) is the difference.
So far this month, we are looking good with $2700 in profit. That’ll cover rent, at least.
This math is automatically filled out if you don’t mess up the spreadsheet you downloaded. The one I put a lot of work into. Please don’t mess it up.
If you do mess it up, just download a new one. Or shoot me an email.
Let’s also look at the Year To Date tab:
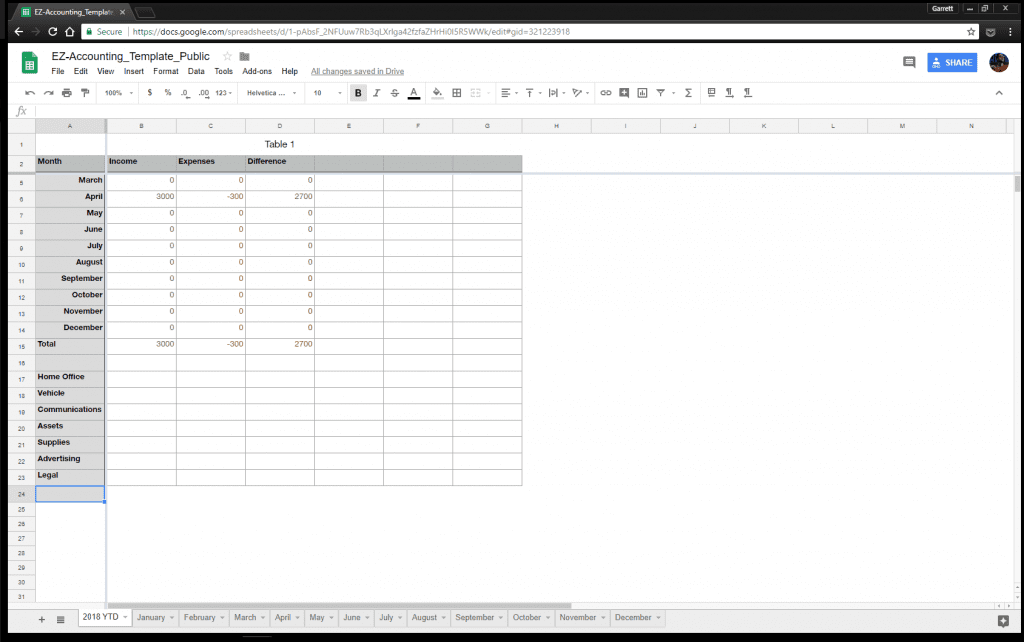
The Year to Date tab, or 2018 YTD, is basically a brief overview. It looks like this:

You’ll need to change this every year as the years change, in a new spreadsheet (don’t overwrite your old ones…keep them!).
As you can see, the month of April has already started filling out.
That’s because I set it up to take from the April tab (and all other months) and input the totals.
We also have a Total line for the whole year. I like being able to quickly take a quick glance and see where I’m at for the year.
In the future, I may add quarterly totals as separate lines. If I do, I’ll be sure to send an email out letting you know.
Below that we have a few categories of items. You can change these and add to or remove from the list.
The categories do not fill themselves out. They are just there for me to keep track when it comes tax time, and you can do the same.
I’d like to figure out how to automate that part in the future, too. I have some ideas but need to work out the kinks. Again, if I make any major changes to the spreadsheet I will let you know. Especially if they’re big new features.
Questions? Comments?
Hope this helps!

Leave a Reply